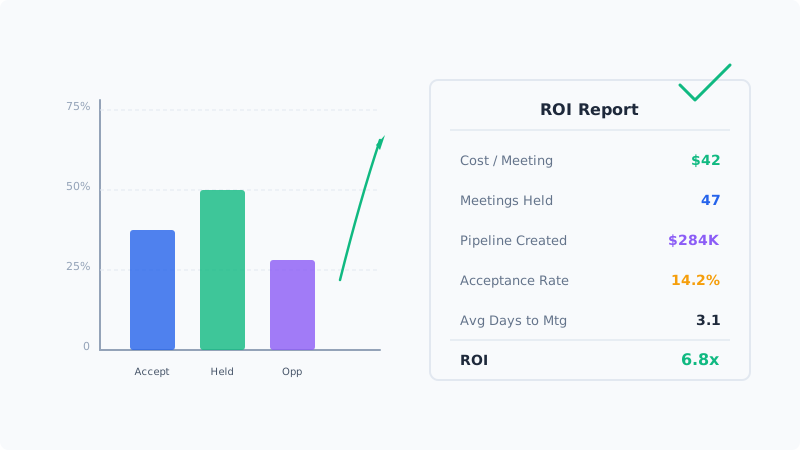
Your team has been running calendar invite outreach for a few weeks. Meetings are landing on the calendar. Reps are having conversations they were not having before. The channel feels like it is working.
Then your VP of Sales asks a simple question: “What is the ROI on this?”
If you cannot answer with specific numbers, the budget for calendar outreach disappears in the next planning cycle. Sales leadership does not fund channels based on vibes. They fund channels that produce measurable pipeline at a defensible cost.
The problem is that most teams try to measure calendar invite outreach using email outreach metrics. Open rates, click rates, reply rates: these are email concepts. Calendar invites operate on a fundamentally different engagement model, and measuring them with the wrong framework makes the channel look worse than it actually is.
Here is how to build a measurement system that captures the real value of calendar invite outreach and presents it in terms your leadership team cares about.
The Metrics That Actually Matter
Acceptance Rate
The acceptance rate is the closest equivalent to “reply rate” in email outreach, but it carries more weight. When a prospect accepts a calendar invite, they are not just expressing interest. They are committing a time slot. That commitment level is significantly higher than a “sounds interesting, tell me more” email reply.
Track acceptance rate as: (invites accepted / invites sent) x 100.
Benchmark: cold calendar invite acceptance rates typically range from 8 to 18% depending on targeting quality and personalization. If you are using Kali for your calendar outreach, the platform tracks this natively so you do not need to build manual reporting.
Compare this to cold email reply rates of 1 to 5%. The raw numbers are higher for calendar invites because the channel is less saturated and the engagement mechanism is different. But do not fall into the trap of comparing acceptance rates to reply rates directly. They measure different types of engagement.
Meeting Held Rate
Not every accepted invite results in a meeting. Prospects cancel, reschedule, or simply do not show up. The meeting held rate measures how many accepted invites actually became conversations.
Track as: (meetings held / invites accepted) x 100.
Benchmark: 60 to 80% of accepted calendar invites result in meetings being held. This is substantially higher than the show rate for meetings booked through email sequences, where prospects often agree to a call and then go dark before the scheduled time.
The gap between acceptance and meeting held is your no-show and cancellation rate. If this gap exceeds 30%, investigate whether your invite timing is off, your descriptions are misleading, or your target list needs refinement. A healthy calendar outreach program should convert most acceptances into actual conversations.
Meeting-to-Opportunity Conversion
This is where calendar outreach proves its value in pipeline terms. Of the meetings held, how many resulted in a qualified opportunity entering your pipeline?
Track as: (opportunities created / meetings held) x 100.
Benchmark: 25 to 45% for well-targeted outreach. Calendar invite meetings tend to convert at higher rates than meetings booked through other outbound channels because the acceptance mechanism filters for more serious prospects. Someone who deliberately accepts a calendar invite and shows up to the meeting has demonstrated more intent than someone who replied “sure” to an email and got scheduled by an SDR.
Cost Per Meeting
This is the metric your CFO cares about. Total spend on calendar invite outreach divided by meetings held.
Include in your cost calculation:
- Tool costs (calendar outreach platform, CRM integrations)
- Data costs (contact enrichment, verified email addresses for invites)
- Rep time (time spent personalizing invites, preparing for meetings, following up)
For teams validating contact data before sending calendar invites, include your Scrubby or other validation costs here. Sending invites to invalid addresses wastes credits and drags down your acceptance rate calculation.
Track as: (total outreach spend / meetings held).
Compare this to your cost per meeting from other channels: cold email, LinkedIn outreach, paid ads, events. Calendar invites typically produce meetings at 30 to 50% lower cost per meeting than cold email because the acceptance-to-meeting conversion is tighter and requires fewer touches.
Pipeline Generated
The ultimate metric. Total pipeline value (in dollars) attributed to meetings sourced from calendar invite outreach.
Track as: sum of opportunity values for all opportunities sourced from calendar invite meetings.
This is the number that justifies the channel. Everything else is a leading indicator. Pipeline generated is the outcome.
Building the Attribution Model
Calendar invite outreach attribution is cleaner than most outbound channels because the path from touch to meeting is direct. There is no ambiguity about whether the prospect saw your message, because accepting a calendar invite is an explicit action.
First-Touch Attribution
If the calendar invite was the first outreach the prospect received, the meeting and any resulting pipeline is fully attributed to calendar outreach. This is straightforward and defensible.
Multi-Touch Attribution
If you run calendar invites alongside email sequences and LinkedIn touches, attribution gets more complex. The cleanest approach: attribute the meeting to whichever channel generated the booking action.
If a prospect received three cold emails, ignored them, then accepted a calendar invite, the meeting is attributed to calendar outreach. The emails contributed awareness, but the calendar invite generated the commitment.
If you are running multi-channel sequences where Kali sends calendar invites as part of a broader sequence alongside email, tag each meeting with the specific touch that triggered the acceptance. This lets you measure each channel’s contribution without double-counting.
Time-to-Meeting
One often-overlooked metric: how many days elapsed between first calendar invite sent and meeting held? Calendar outreach typically compresses this timeline compared to email sequences, where you might send 5 to 7 touches over 2 to 3 weeks before getting a reply, then schedule a meeting another week out.
Calendar invites collapse the funnel. One touch creates the meeting. Track time-to-meeting as evidence that calendar outreach accelerates pipeline velocity, not just pipeline volume.
Presenting to Sales Leadership
Your VP of Sales does not want a spreadsheet with 15 metrics. They want answers to three questions:
1. Is this channel producing pipeline?
Lead with pipeline generated and number of meetings held. Show the trend over the last 30, 60, and 90 days. If you are early, show weekly trends. Pipeline growth over time is the single strongest signal that the channel is working.
2. How does it compare to other channels?
Build a simple comparison table:
| Metric | Calendar Invites | Cold Email | |
|---|---|---|---|
| Cost per meeting | $X | $Y | $Z |
| Meeting-to-opp rate | X% | Y% | Z% |
| Avg days to meeting | X | Y | Z |
| Pipeline generated | $X | $Y | $Z |
This table tells the story without you having to argue for the channel. If calendar invites produce meetings at lower cost with higher conversion rates, the numbers speak for themselves.
3. What happens if we invest more?
Model the scale-up scenario. If you are currently sending 200 invites per week and generating 20 meetings per month, what happens at 500 invites per week? Project the pipeline impact based on your current conversion rates.
Include capacity constraints: does scaling require more reps, better data, or just more tool capacity? Leadership wants to know not just the upside, but the operational requirements to capture it.
Common Reporting Mistakes
Counting Acceptances as Wins
An accepted invite that does not result in a meeting is not a win. Report meetings held, not invites accepted. Acceptance rate is a leading indicator. Meetings held is the output metric.
Ignoring Decline Data
Declines contain valuable information. If prospects are actively declining (rather than ignoring), they engaged with the invite. Track decline rates and look for patterns: are certain titles declining more? Are invites sent on certain days getting more declines? Declines are a signal, not just a loss.
Reporting in Isolation
Calendar invite metrics in a vacuum are meaningless. Always present them alongside other channel metrics. The goal is not to prove calendar invites work in absolute terms. The goal is to prove they are a productive part of your overall outbound mix, ideally with better efficiency than at least one other channel.
Forgetting to Track Influenced Pipeline
Some calendar invite meetings will not convert to opportunities immediately. The prospect might enter the pipeline three months later through a different channel. If you only track first-touch pipeline, you miss the influence that the calendar meeting had on warming the account.
Use your CRM’s multi-touch attribution to capture influenced pipeline alongside sourced pipeline. Both numbers matter for understanding the full value of calendar outreach.
Setting Up Tracking From Day One
Do not wait until leadership asks for ROI to start tracking. Build the measurement infrastructure before you send your first batch of calendar invites.
- Tag all calendar invite meetings in your CRM with a consistent source field (e.g., “Calendar Outreach” or “Kali”).
- Create a dedicated pipeline view that filters for opportunities sourced from calendar meetings.
- Set up weekly reporting that captures invites sent, acceptances, meetings held, and opportunities created.
- Establish baselines in your first 30 days. Do not expect to report meaningful ROI until you have at least 60 days of data.
The teams that scale calendar outreach successfully are the ones that can prove its value with data. The teams that lose budget are the ones that say “it feels like it is working” when leadership asks for proof.
Build the measurement system. Let the numbers make the case.